Real-Time Health Scores
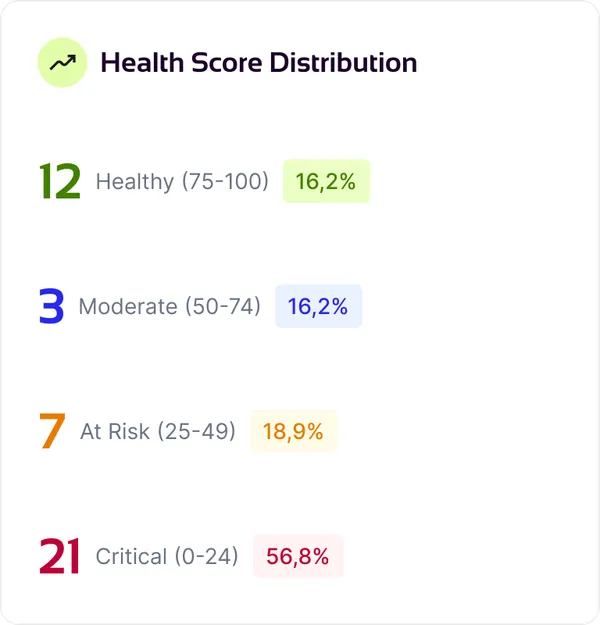
Composite score based on activity, features, and engagement. Configurable components and weights. Auto-calculated every hour.

LogoPulse tracks every step of your customer journey — from signup to first value to power user. Know who's stuck in onboarding, who's actively getting value, and who's going quiet. One SDK. Real-time visibility. No spreadsheet required.
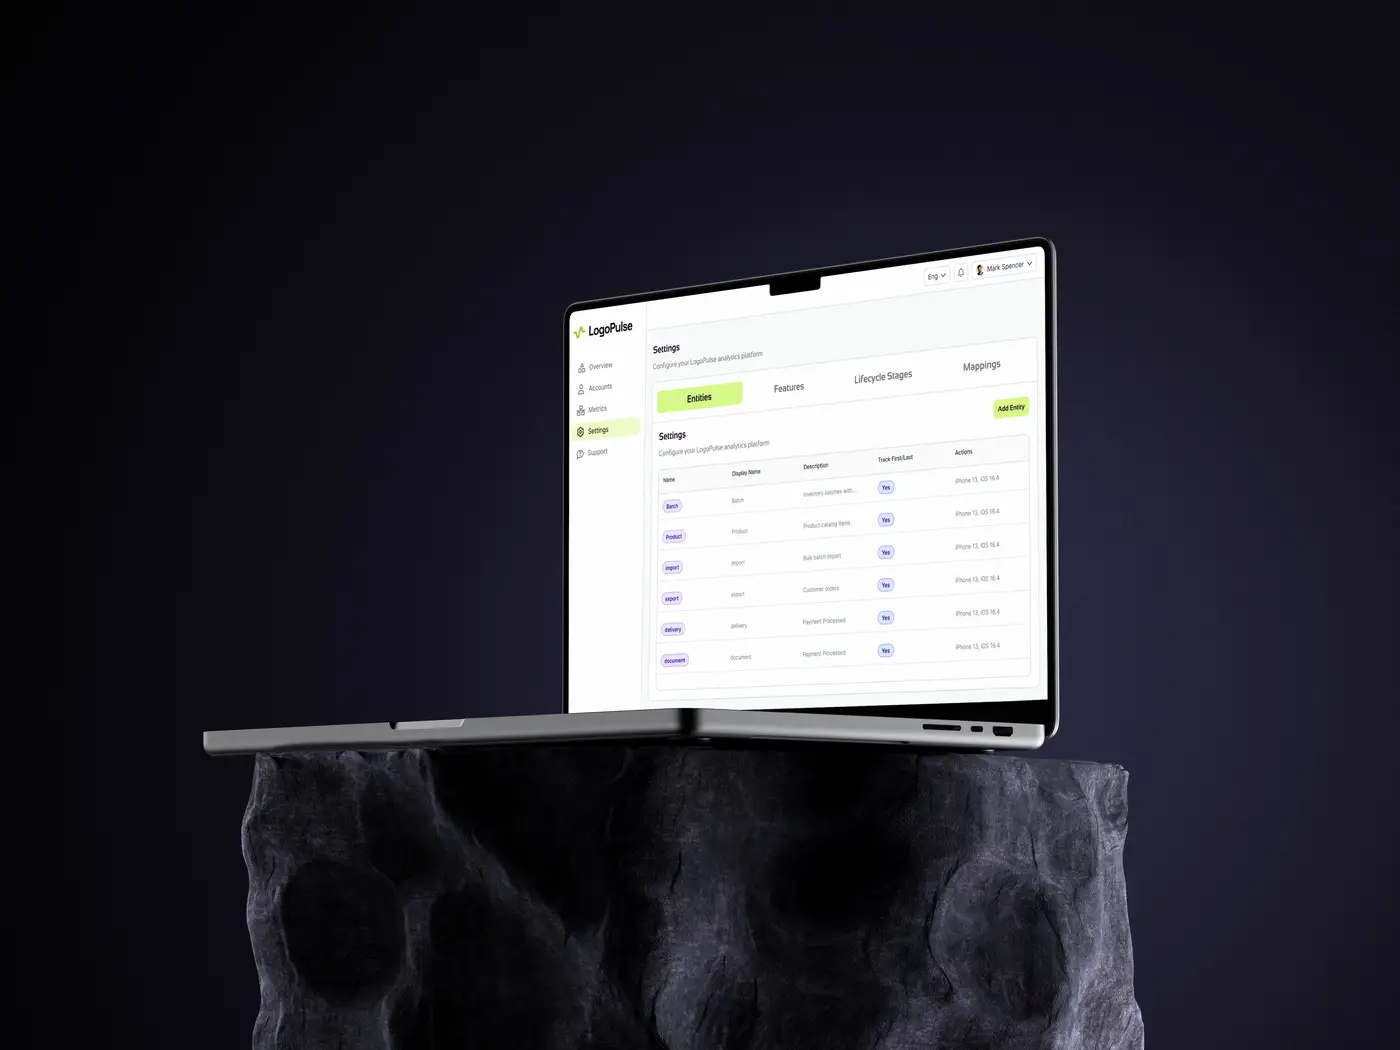
40 customers signed up last month. How many connected their integration? How many created their first order? How many are stuck on step 2? You don't know — because nobody's tracking it.
You call them active because they logged in. But did they actually do anything? Without tracking what customers create and use, "active" is meaningless — and so is "churned." You can't churn a customer who never got started.
A customer signed up 3 weeks ago and never finished setup. Another was active for a month and went quiet. Both need different help — but right now they look the same: silent until they cancel.
LogoPulse connects to your product via a lightweight SDK. Every meaningful action your customers take — completing setup, creating their first record, adopting features — gets tracked, measured, and surfaced automatically.
Define your customer journey as stages: Signup → Integration Connected → First Entity → Active → Power User. LogoPulse moves customers through automatically as they hit milestones. See exactly where people get stuck and for how long.
Track what customers create — orders, batches, documents, projects. See velocity, trends, and per-account breakdowns. An account with 50 orders/week and one with 1 order/month are both "active" — but they're not the same.
Every customer gets a real-time score combining activity frequency, feature adoption, onboarding completion, and engagement patterns. When a score starts declining, you have weeks to intervene — not a cancellation email.
import { createLogoPulse } from '@logopulse/sdk';

const lp = createLogoPulse({
  apiKey: 'your-api-key',
  orgId: 'your-org'
});

await lp.track('batch.created', accountId, { batchId: '123' });Install the LogoPulse SDK (npm package, < 5 minutes). Initialize with your API key and start tracking events.
Define what matters for your business: which entities to track, what features to monitor, how to weight your health score, what onboarding stages look like. All from the dashboard — no code changes.
See which customers are thriving and which need help. Health scores, onboarding funnels, activity heatmaps, and trend charts — all in one place.
Composite score based on activity, features, and engagement. Configurable components and weights. Auto-calculated every hour.
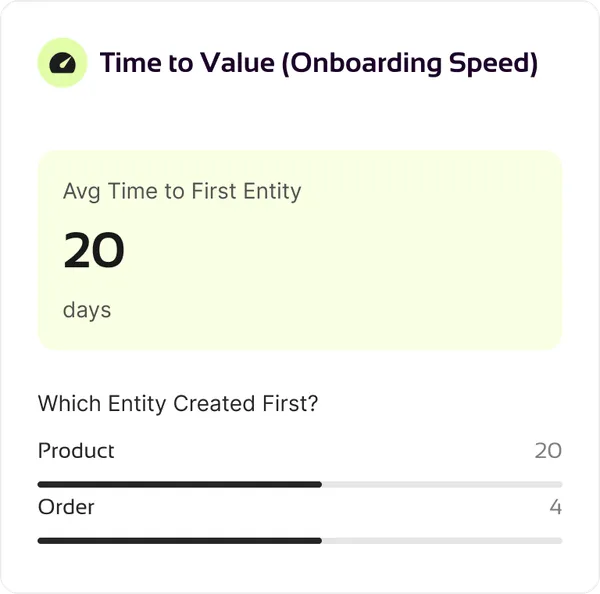
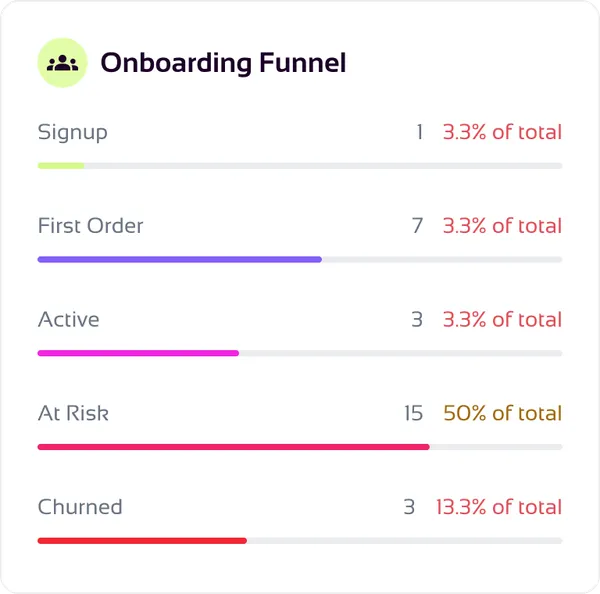
Define custom stages with automatic progression rules. See funnel drop-off and time-to-stage metrics.
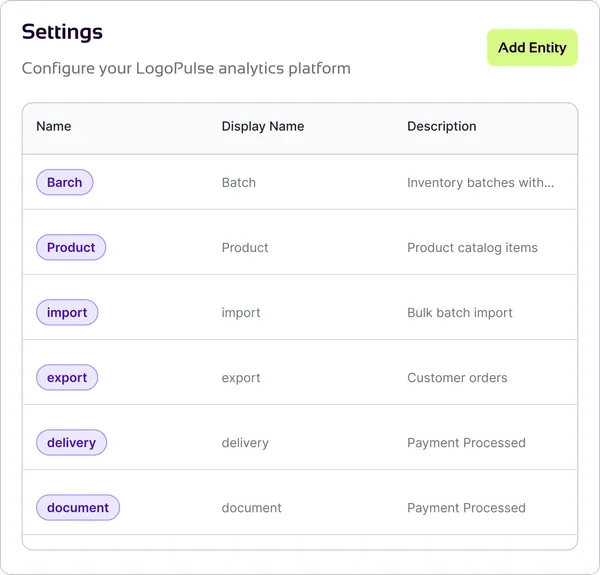
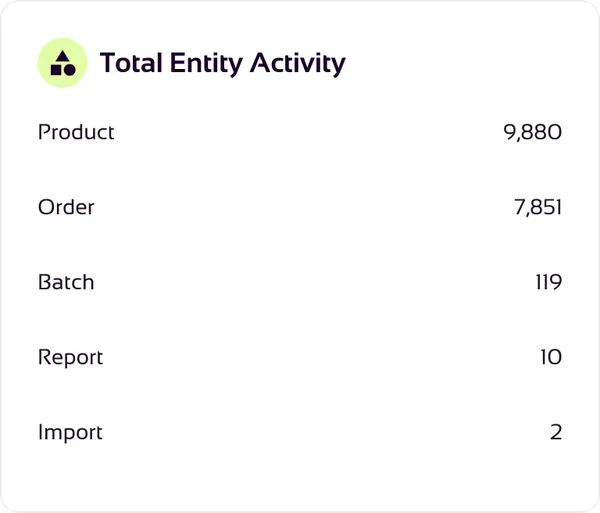
Track any entity type (orders, projects, documents). See creation velocity, trends, and per-account breakdowns.
Monitor which features each customer uses. Track first use, usage frequency, and adoption rates across your base.
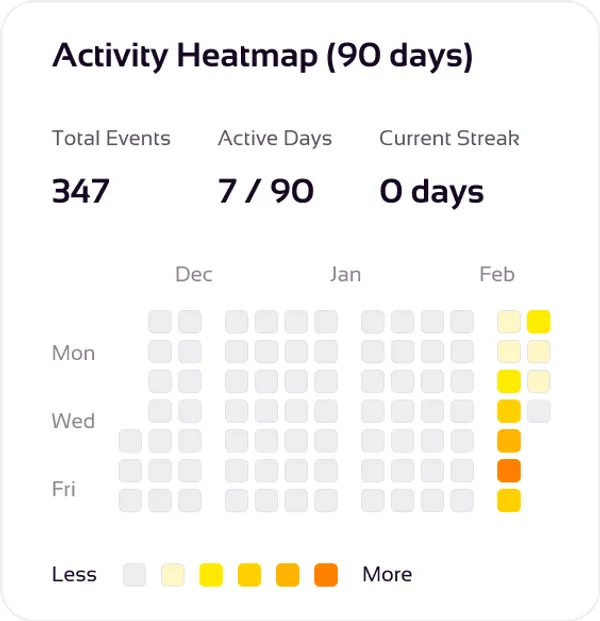
Visualize customer engagement over 90 days. Spot quiet periods and engagement streaks at a glance.
Automatic flags: declining health, activity gaps, stalled onboarding. Catch problems before they become cancellations.
| Criteria | Spreadsheets | LogoPulse | Enterprise CS Platforms |
|---|---|---|---|
| Setup time | N/A | 10 minutes | 2-6 weeks |
| Monthly cost | Free | Free – $349/mo | $500-5,000+/mo |
| Health scores | Manual | Automatic | Automatic |
| Onboarding tracking | Manual | Automatic | Automatic |
| Entity tracking | Manual | Automatic | Limited |
| Custom entity types | N/A | Unlimited | Requires config |
| Multi-tenant | N/A | Built-in | Varies |
| API-first | N/A | Yes | Some |
| Time to value | Immediate | < 1 hour | Weeks |
| Right for | 1-10 customers | Any size | 500+ customers |
Catch declining health scores and activity gaps before customers decide to leave.
Learn more about Reduce ChurnSee exactly where customers get stuck in your onboarding flow and how long each step takes.
Learn more about Optimize OnboardingIdentify your healthiest, most active customers — the ones most likely to upgrade, expand, or refer.
Learn more about Drive Expansion$0 /mo
$49 /mo
$169 /mo
$349 /mo
First 20 accounts free — forever. Auto-upgrades when you grow.
Need 500+? Enterprise pricing
See Full Pricingnpm install @logopulse/sdk), add your API key, and start sending events. Dashboard configuration (health score weights, onboarding stages) takes another 15-30 minutes.Set up LogoPulse in 10 minutes. See your first health scores in under an hour.